Y90s Print and Performance Visualization Gallery
This gallery allows for side by side comparison of the Y90s Print and Performance dataset visualizations. Each periodical has three visualizations. Each visualization highlights a specific part of the dataset according to correspondence type, correspondence amount, addressee, and writer. The correspondence types include political, theatre, personal, business, or other. The addressee in each visualization is either Ellen Terry or Edith Craig. The writers are all contributors to the Yellow Nineties magazines.
The Circle Visualizations best highlight the type of correspondence sent to Ellen Terry or Edith Craig.
The Circle Packing Diagram best displays the amount of correspondence sent to either Terry or Craig, and is organized by the different correspondence types.
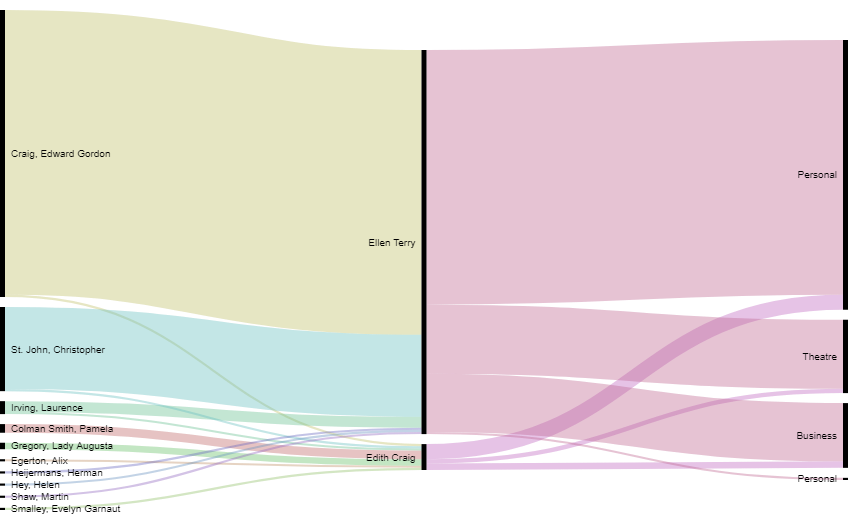
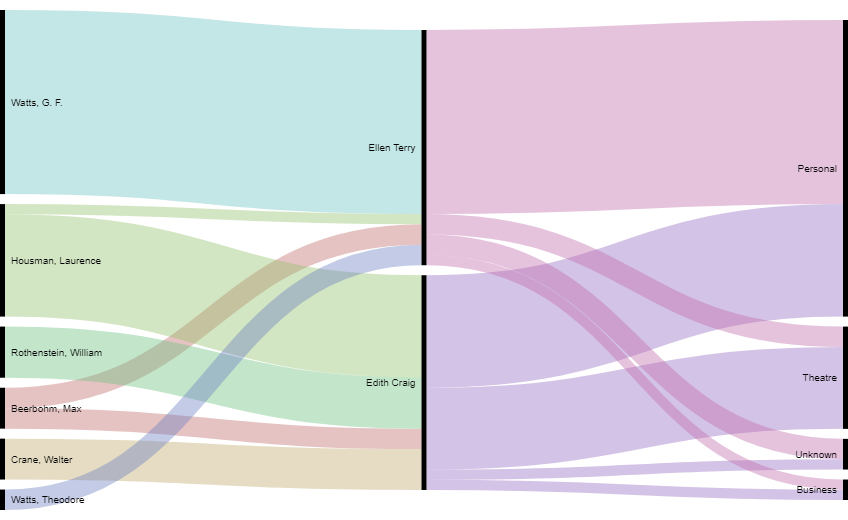
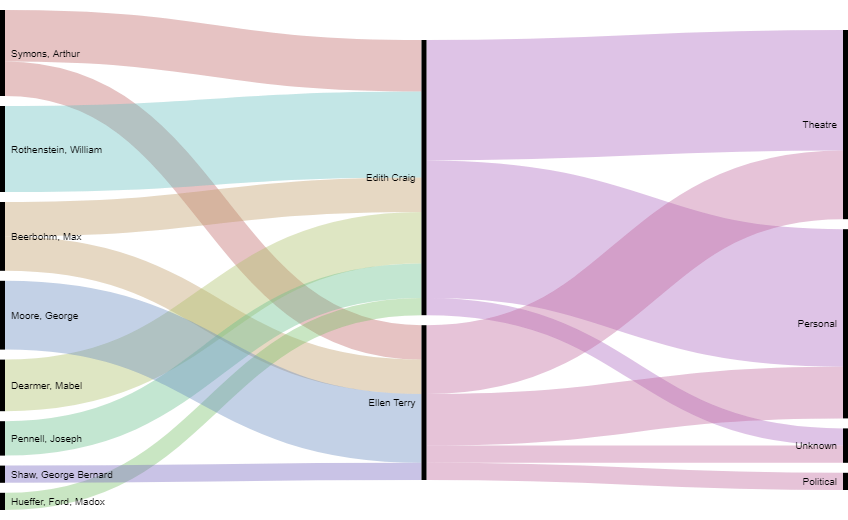
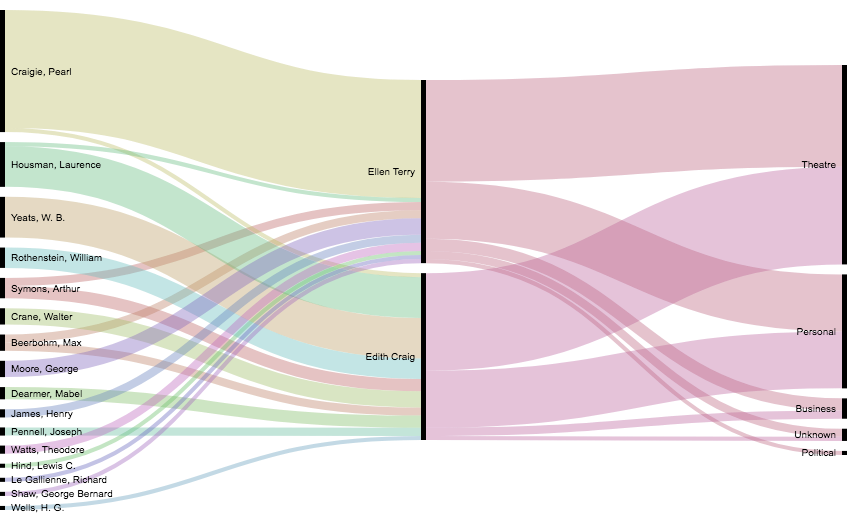
The Alluvial Diagrams best display the amount of correspondence addressed to either Terry or Craig from contributors in each dataset.
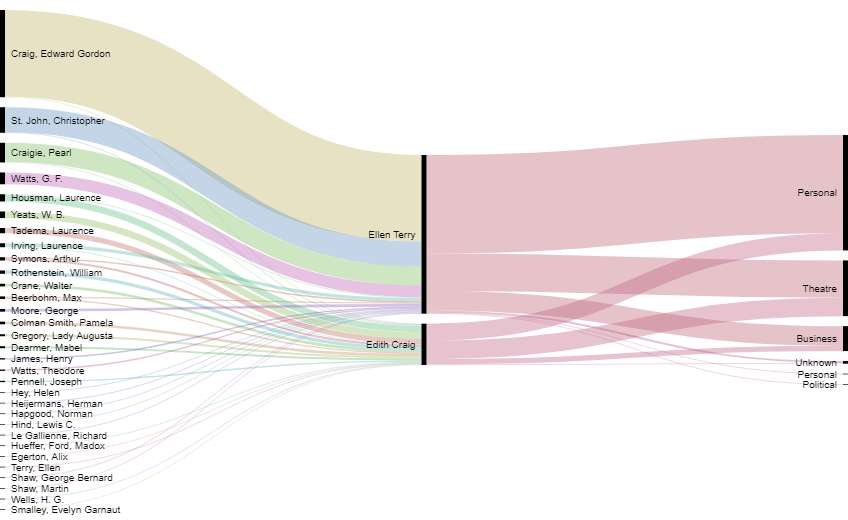
Overall Dataset Alluvial Diagram 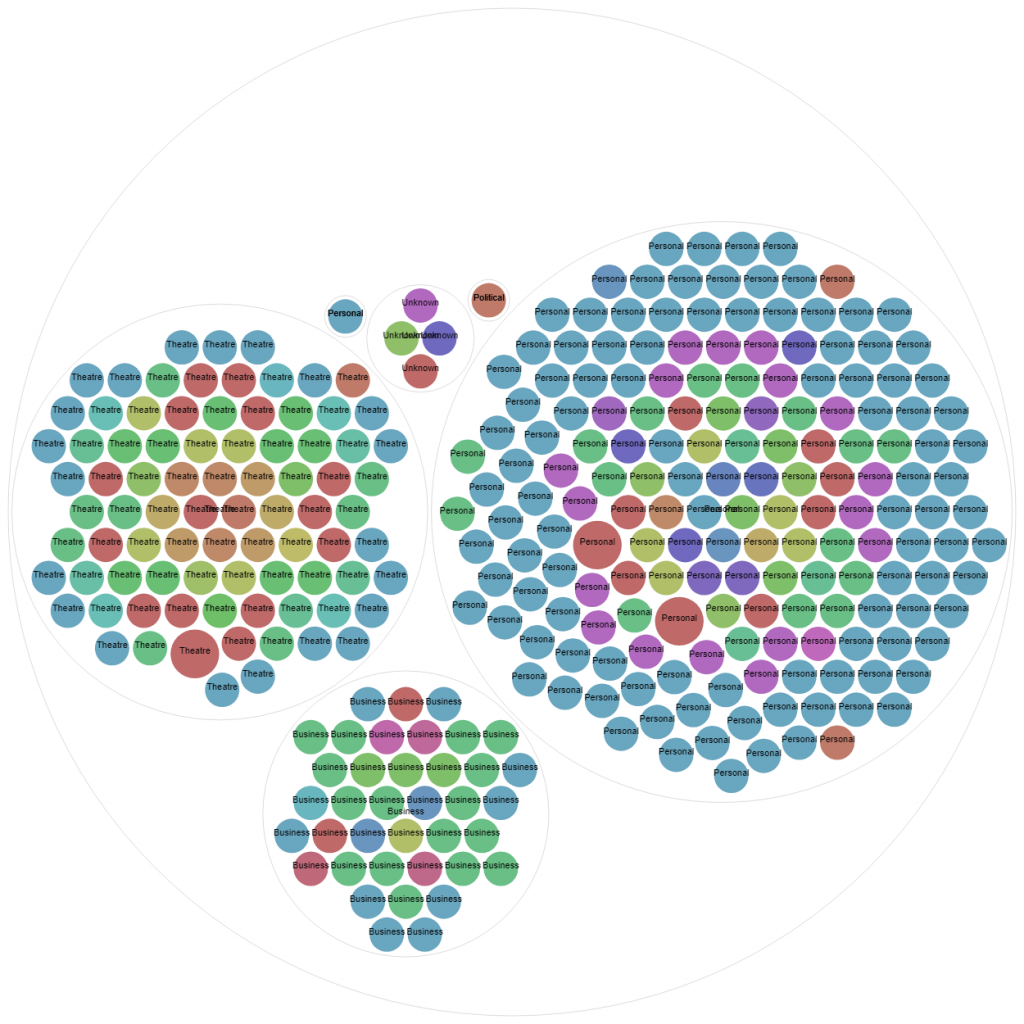
Overall Dataset Circle Packing Diagram 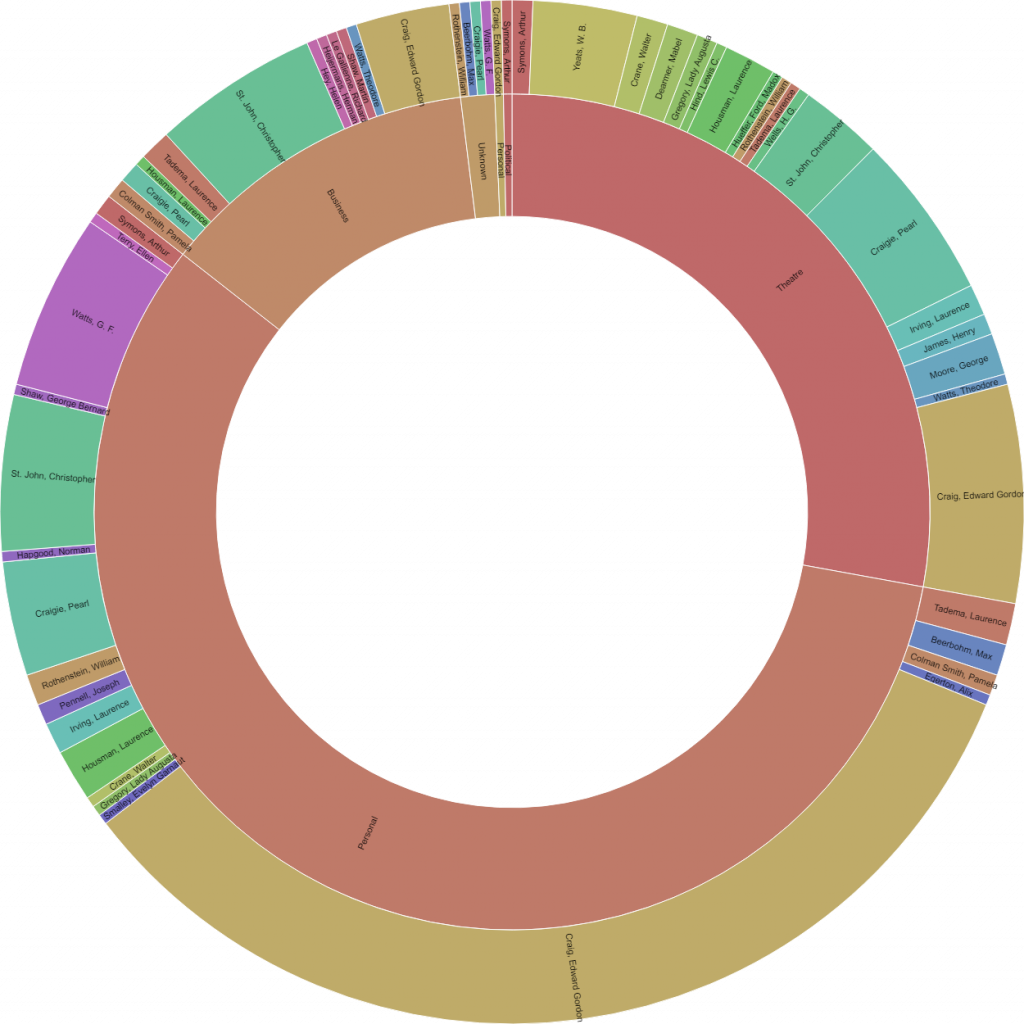
Overall Dataset Circle Visualization
Overall Dataset Visualizations
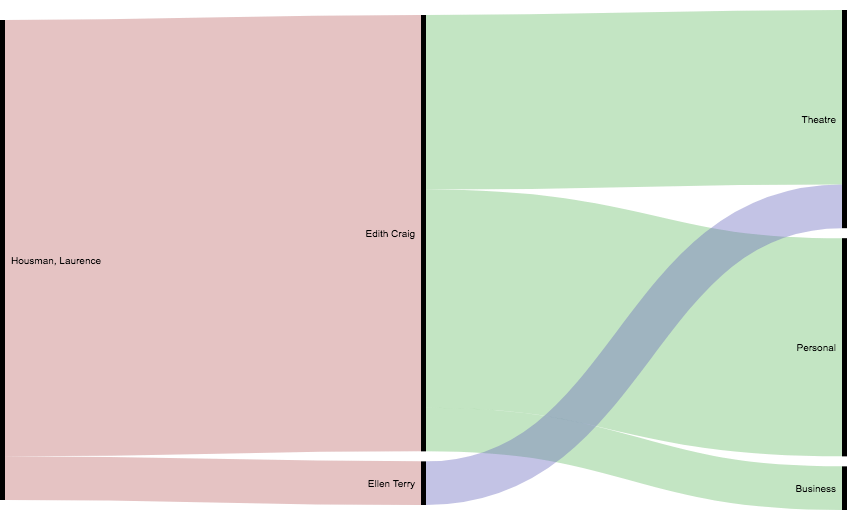
Dial Dataset Alluvial Diagram 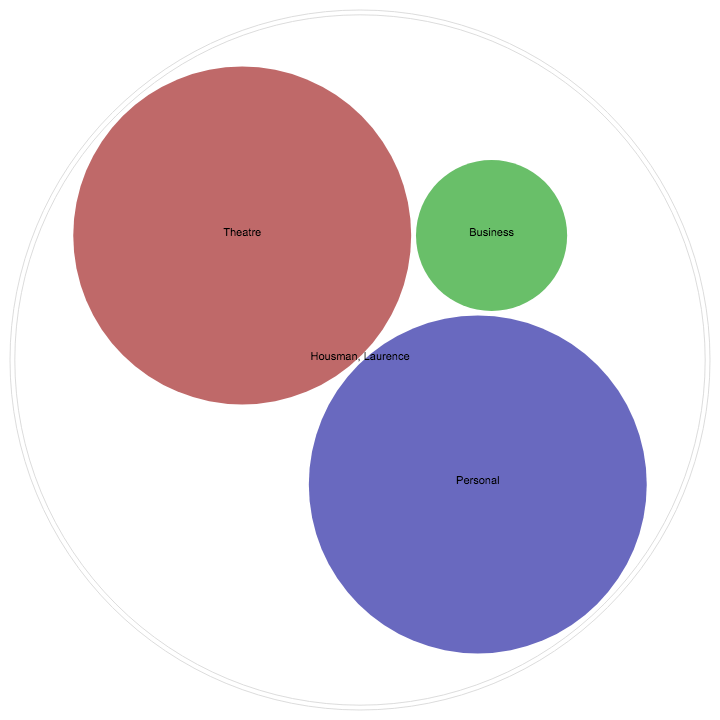
Dial Dataset Circle Packing Diagram 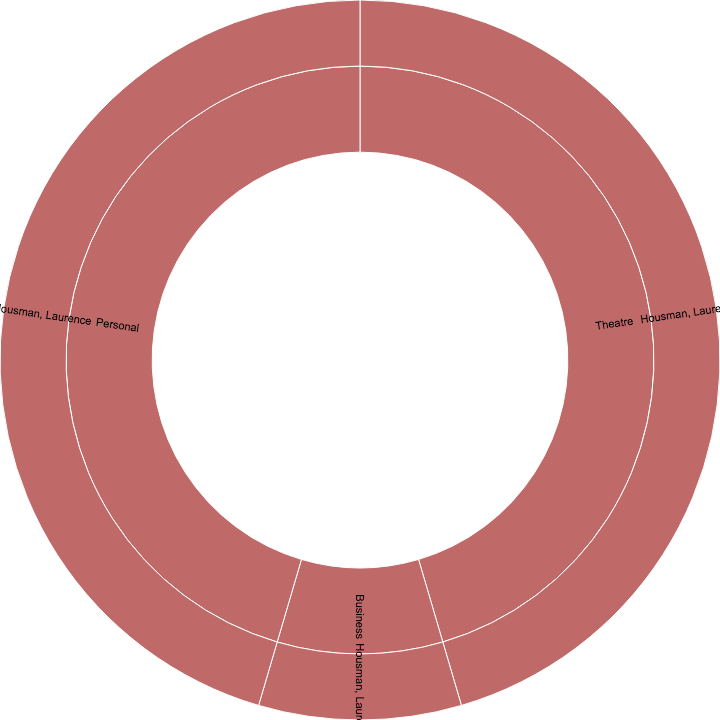
Dial Dataset Circle Visualization
The Dial Dataset Visualizations
Green Sheaf Dataset Alluvial Diagram 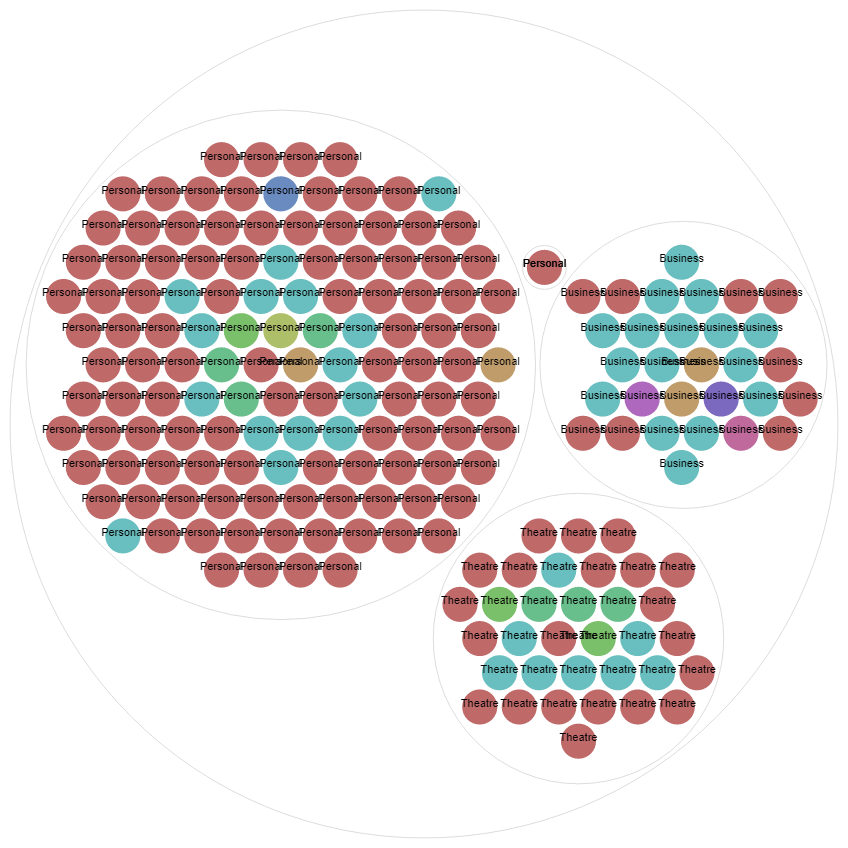
Green Sheaf Dataset Circle Packing Diagram 
Green Sheaf Dataset Circle Visualization
The Green Sheaf Dataset Visualizations
The Pagent Dataset Alluvial Diagram 
The Pagent Dataset Circle Packing Diagram 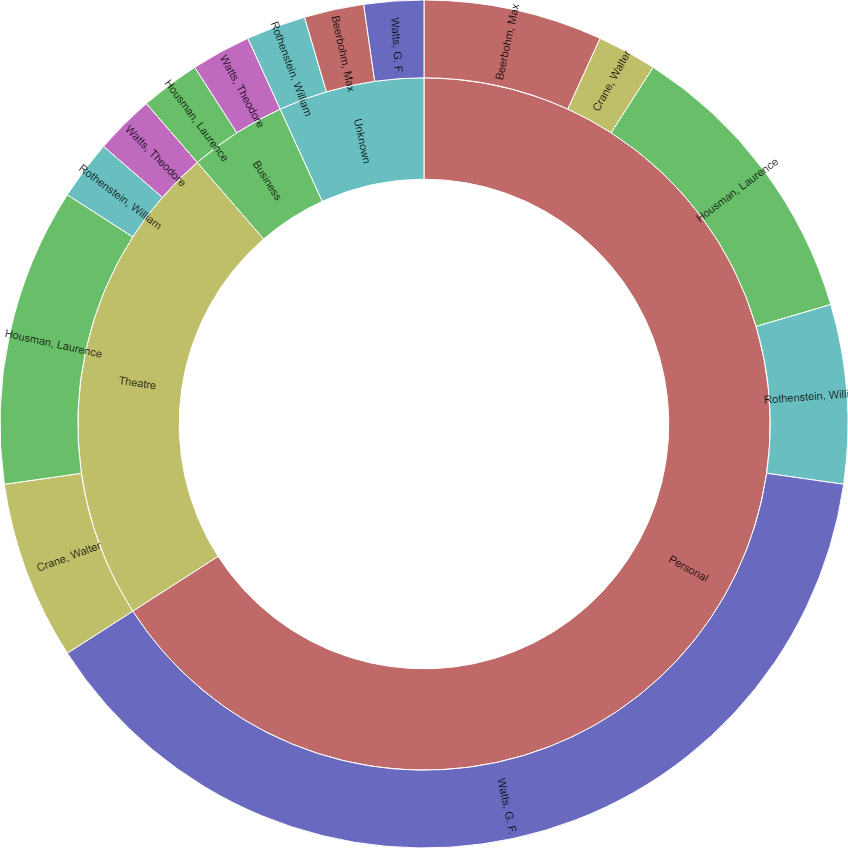
The Pagent Dataset Circle Visualization
The Pagent Dataset Visualizations
The Savoy Dataset Alluvial Diagram 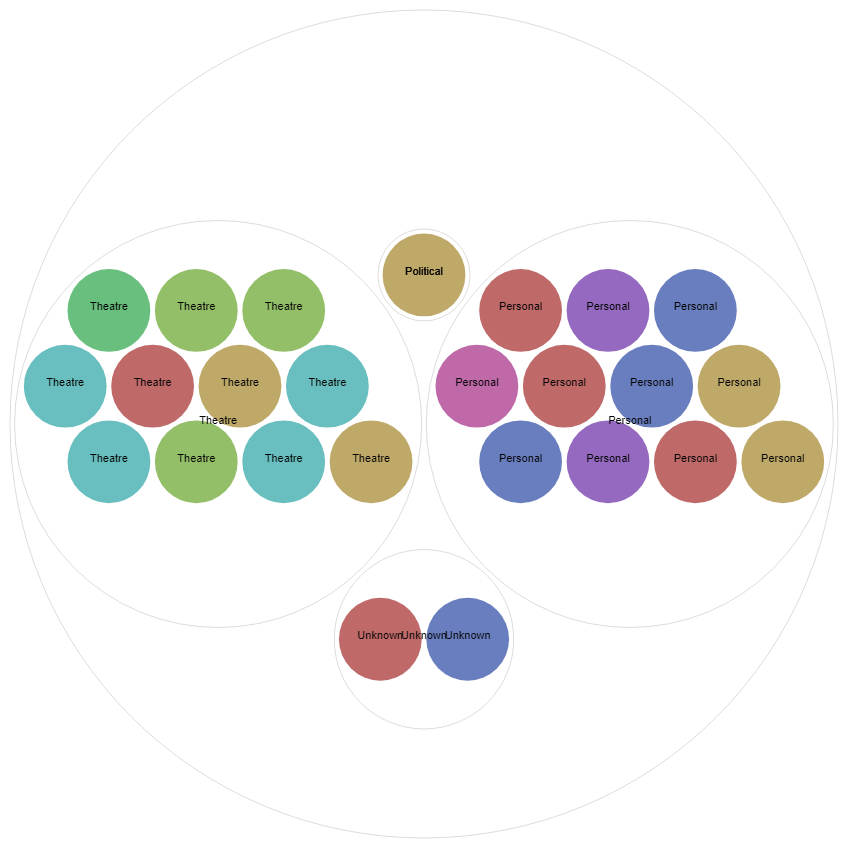
The Savoy Dataset Circle Packing Diagram 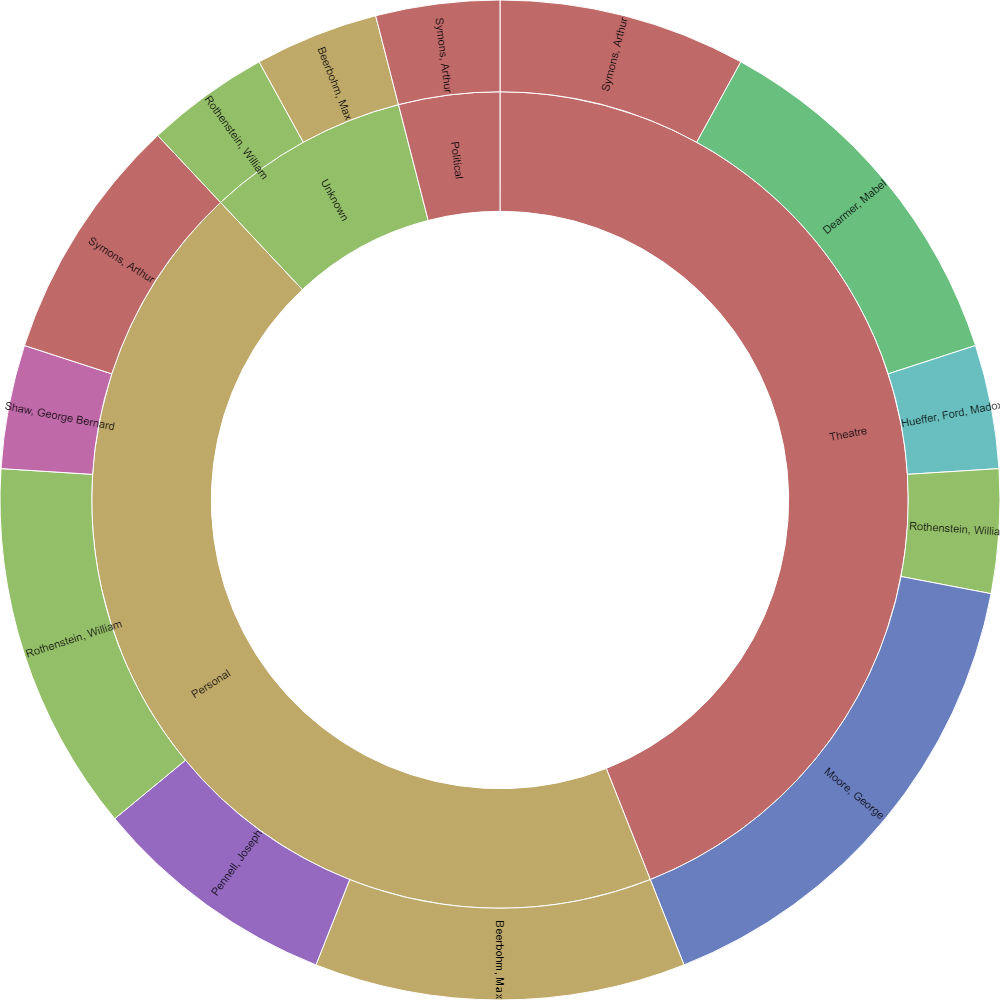
The Savoy Dataset Circle Visualization
The Savoy Dataset Visualizations
The Yellow Book Dataset Alluvial Diagram 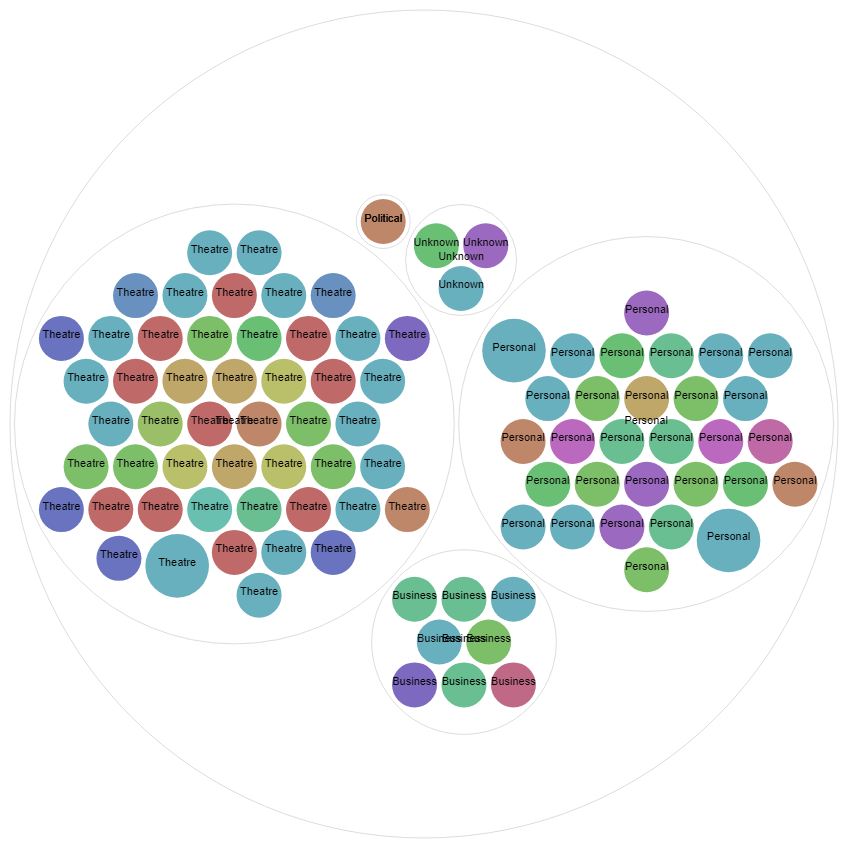
The Yellow Book Circle Packing Diagram 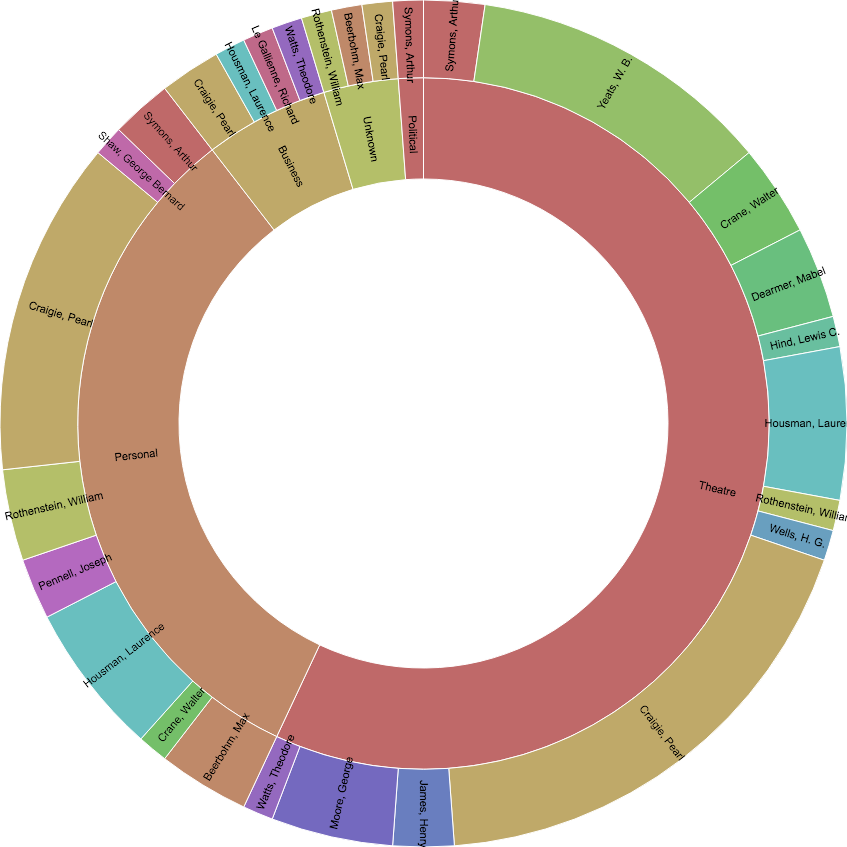
The Yellow Book Circle Visualization
The Yellow Book Data Visualizations